Turbo Coin Surges: Analyzing the Impressive Rally and Market Trends
In a remarkable display of market momentum, Turbo ($TURBO) has…

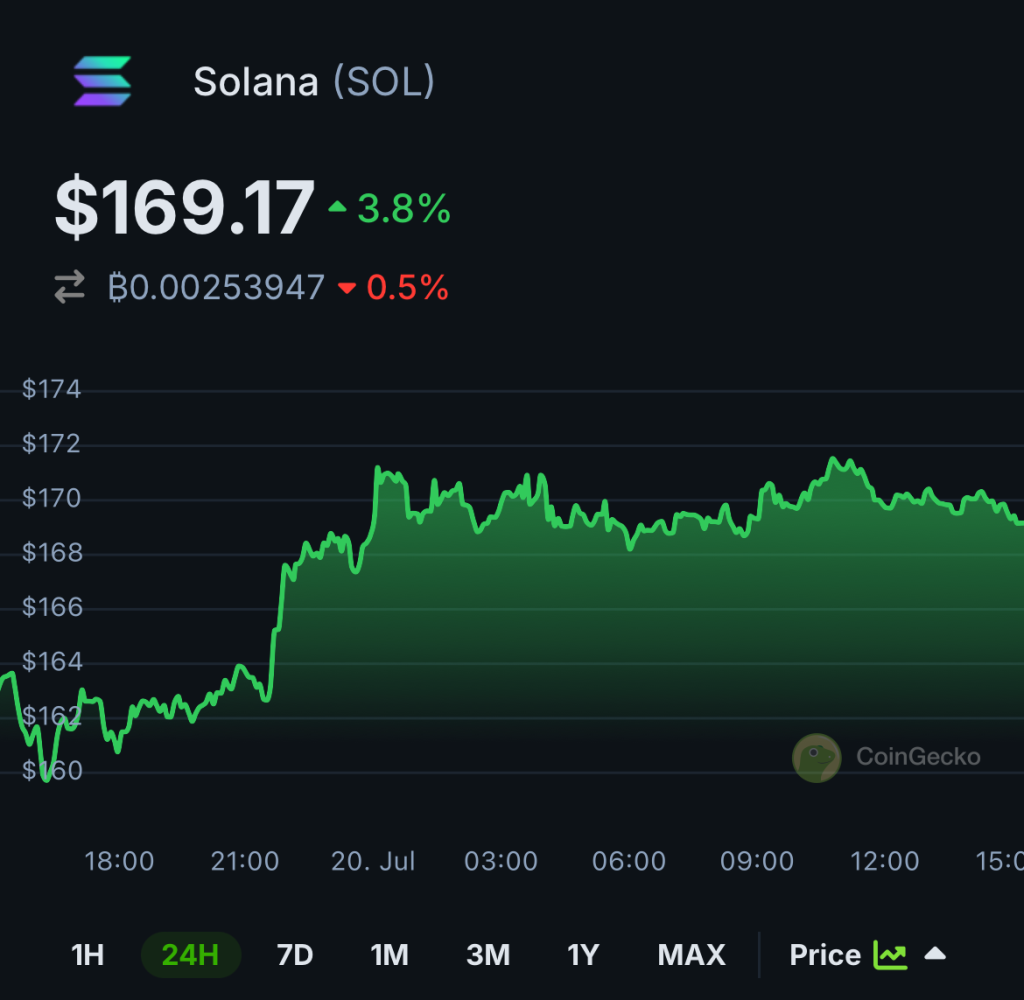
In the past week, Solana (SOL) has seen an impressive 20% rise, with a 5% increase in just the last 24 hours, pushing its price to $169.17 as of 3:00 PM UTC +8. This recent surge has caught the attention of crypto analysts, who have identified a bullish pennant formation on the SOL/USD trading pair on the one-day timeframe.

A bullish pennant is a common technical analysis pattern that occurs after a strong price increase, followed by a period of consolidation within converging trend lines, forming the shape of a pennant. This pattern typically indicates a continuation of the prior upward trend after the consolidation phase ends. For traders, this is often seen as a potent continuation signal, suggesting that the bullish momentum is likely to resume.
Despite the surface appearance of a bearish trend due to a series of lower highs, deeper analysis reveals that Solana’s price action has developed a bullish pennant. Several factors are contributing to a potential upside:
Solana has successfully surpassed the 50% Fibonacci retracement level at $169.17 and is now challenging the upper boundary of the pennant. Pushing past this barrier could trigger the bullish pattern, propelling further price increases.
The Relative Strength Index (RSI) has crossed above the median line of 50, with a pattern of higher lows indicating increasing momentum, which supports a potential upward trajectory for SOL.
The Moving Average Convergence Divergence (MACD) indicator reinforces the bullish outlook, maintaining a position above its signal line. The presence of green histograms highlights the prevailing bullish sentiment, suggesting that Solana’s price might continue its ascent.
Should the current bullish indicators continue to hold, the Solana price could soon reach new heights, potentially testing the $174.53 mark and possibly extending up to $187.66. If the bullish pennant pattern reaches its full potential, marked by the maximum height between the trendlines, Solana could experience a substantial 77% rally, targeting a peak beyond $210.
Conversely, if Solana faces rejection at the current upper trendline, it might retreat to test support at the 61.8% Fibonacci level. A successful bounce from this level could reignite bullish momentum. However, if this support breaks, Solana could see a further drop to the 71.8% Fibonacci level at $138.20. A decisive close below the pennant’s lower trendline would negate the bullish forecast and could lead to further declines.
As Solana navigates through these technical thresholds, both traders and investors should closely monitor these key indicators and price levels. The evolving bullish pennant suggests that Solana is gearing up for potentially significant gains, making it a critical watch for those involved in the cryptocurrency market.
Disclaimer: The projections and information presented here are for educational purposes only and should not be considered financial advice. CoinGrab.Asia assumes no responsibility for any losses resulting from the use of this data. Readers are encouraged to perform their own research and proceed cautiously before engaging in any related activities.